Monitor LLM performance
You can set up hila to monitor user activity, internal SQL-related performance, and system performance. You can monitor these activities against the baseline of previous days, weeks, and months.
- Monitoring user activities involves monitoring how many user questions match SQL in the system.
- Monitoring SQL-related performance involves monitoring SQL confidence scores, generated SQL syntax and semantics matching, SQL execution results, and how relevant LLM answers are to the user query.
- Monitoring system performance involves monitoring LLM cost, LLM token efficiency, and LLM latencies.
The following are the steps for setting up hila monitoring:
- Run the CF_structured_monitoring.ipynb notebook.
- View model performance over time in the monitoring window.
- View policy results in the policies window.
Prerequisites
To run hila monitoring, you must have a metadata in place that defines the models and SQL for your system.
Run the notebook
The CF_structured_monitoring.ipynb notebook sets up hila for monitoring the system.
-
Open the notebook in edahub. See Open edahub.
In edahub, the notebook is located at
/notebooks/public/hila_monitoring/dev/CF_structured_monitoring.ipynb. -
Run the notebook.
-
When running the second cell, you must give your username, password, and the name of the metadata you want hila to monitor.
-
Run the rest of notebook to load back inferences, create and run policies, and start monitoring model performance.
Note: Loading back inferences loads sixty days worth of data to populate the monthly and weekly policies with valid, if fictitious, data.
View model performance
Open the monitoring app at https://monitoring.<your-stack-domain>.
-
Select QNA Project from the projects dropdown.
-
Select your model name from the dropdown. Your model name is the same as your metadata name.
-
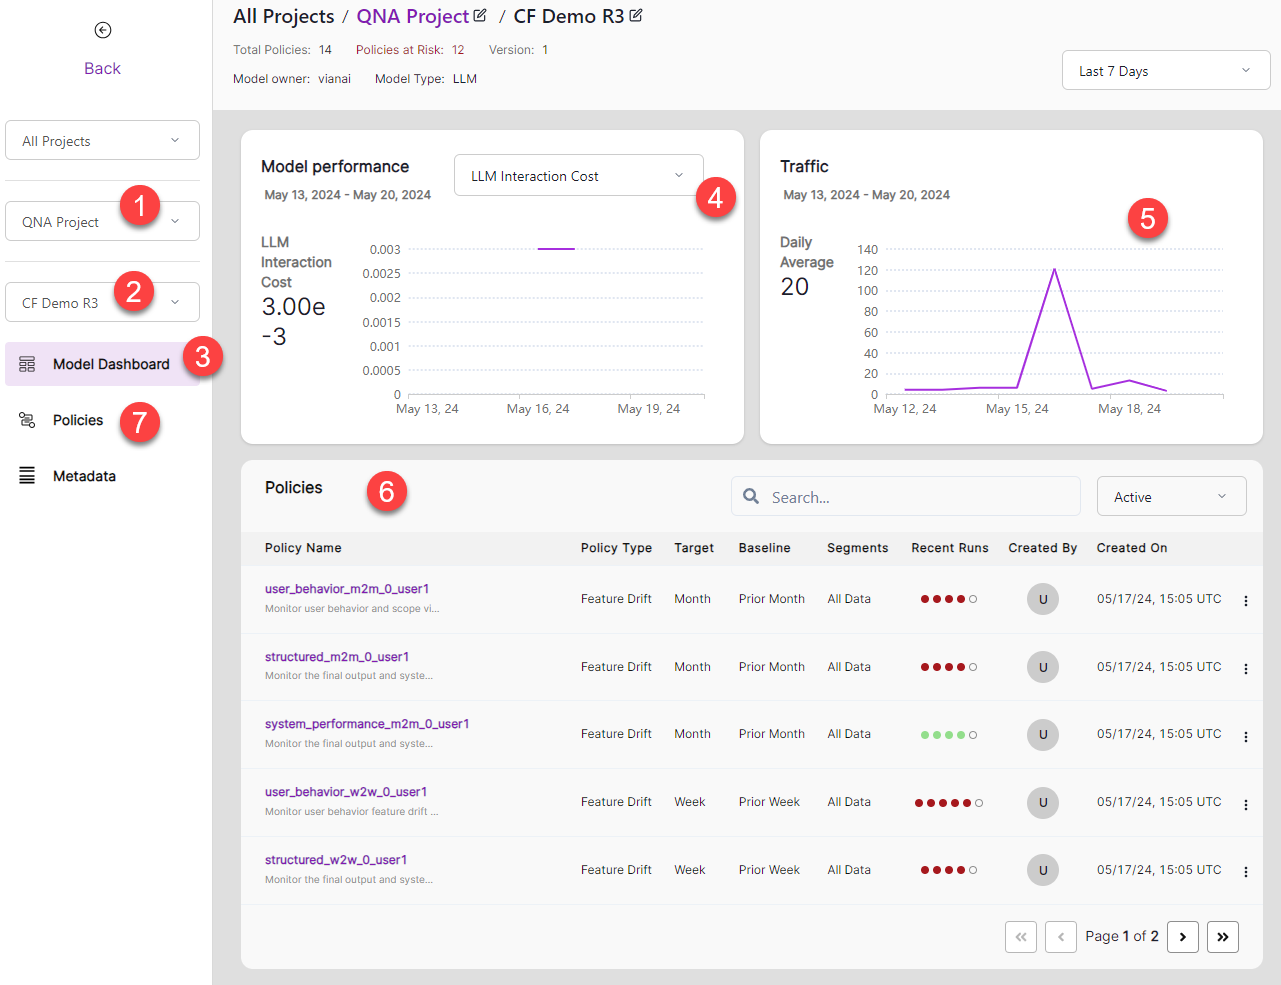
The initial monitoring window is Model Dashboard.
-
Select the metric you want to view from the metric dropdown.
- LLM Interaction Cost Total cost associated with querying large language models (LLMs), including both the cost of sending the input and receiving the output.
- LLM Interaction Latency The total time spent waiting for LLMs to respond, measured from when a question is submitted until the final response is received.
- LLM Prompt Cost The cost of sending the prompt, measured in terms of number of tokens and cost per token.
- LLM Response Relevance A score for how relevant the answer is to the user query.
- SQL Match A score for how well the semantics of the generated SQL matches SQL in the system.
- SQL Syntax Match A score for how well the syntax of the generated SQL matches SQL in the system.
- Token Efficiency A measure of how effectively the LLM uses tokens to generate accurate and relevant responses.
- Top Match Similarity A score for how well the user questions match the top matched SQL in the system.
-
View the total number of questions asked over the selected time frame.
-
The top five policies appear at the bottom of the window. Click the arrow controls to view other pages.
Select a policy to view performance details related to that policy.
-
View the full list of policies in the Policies window.
Select a policy to view performance details related to that policy.
Policies
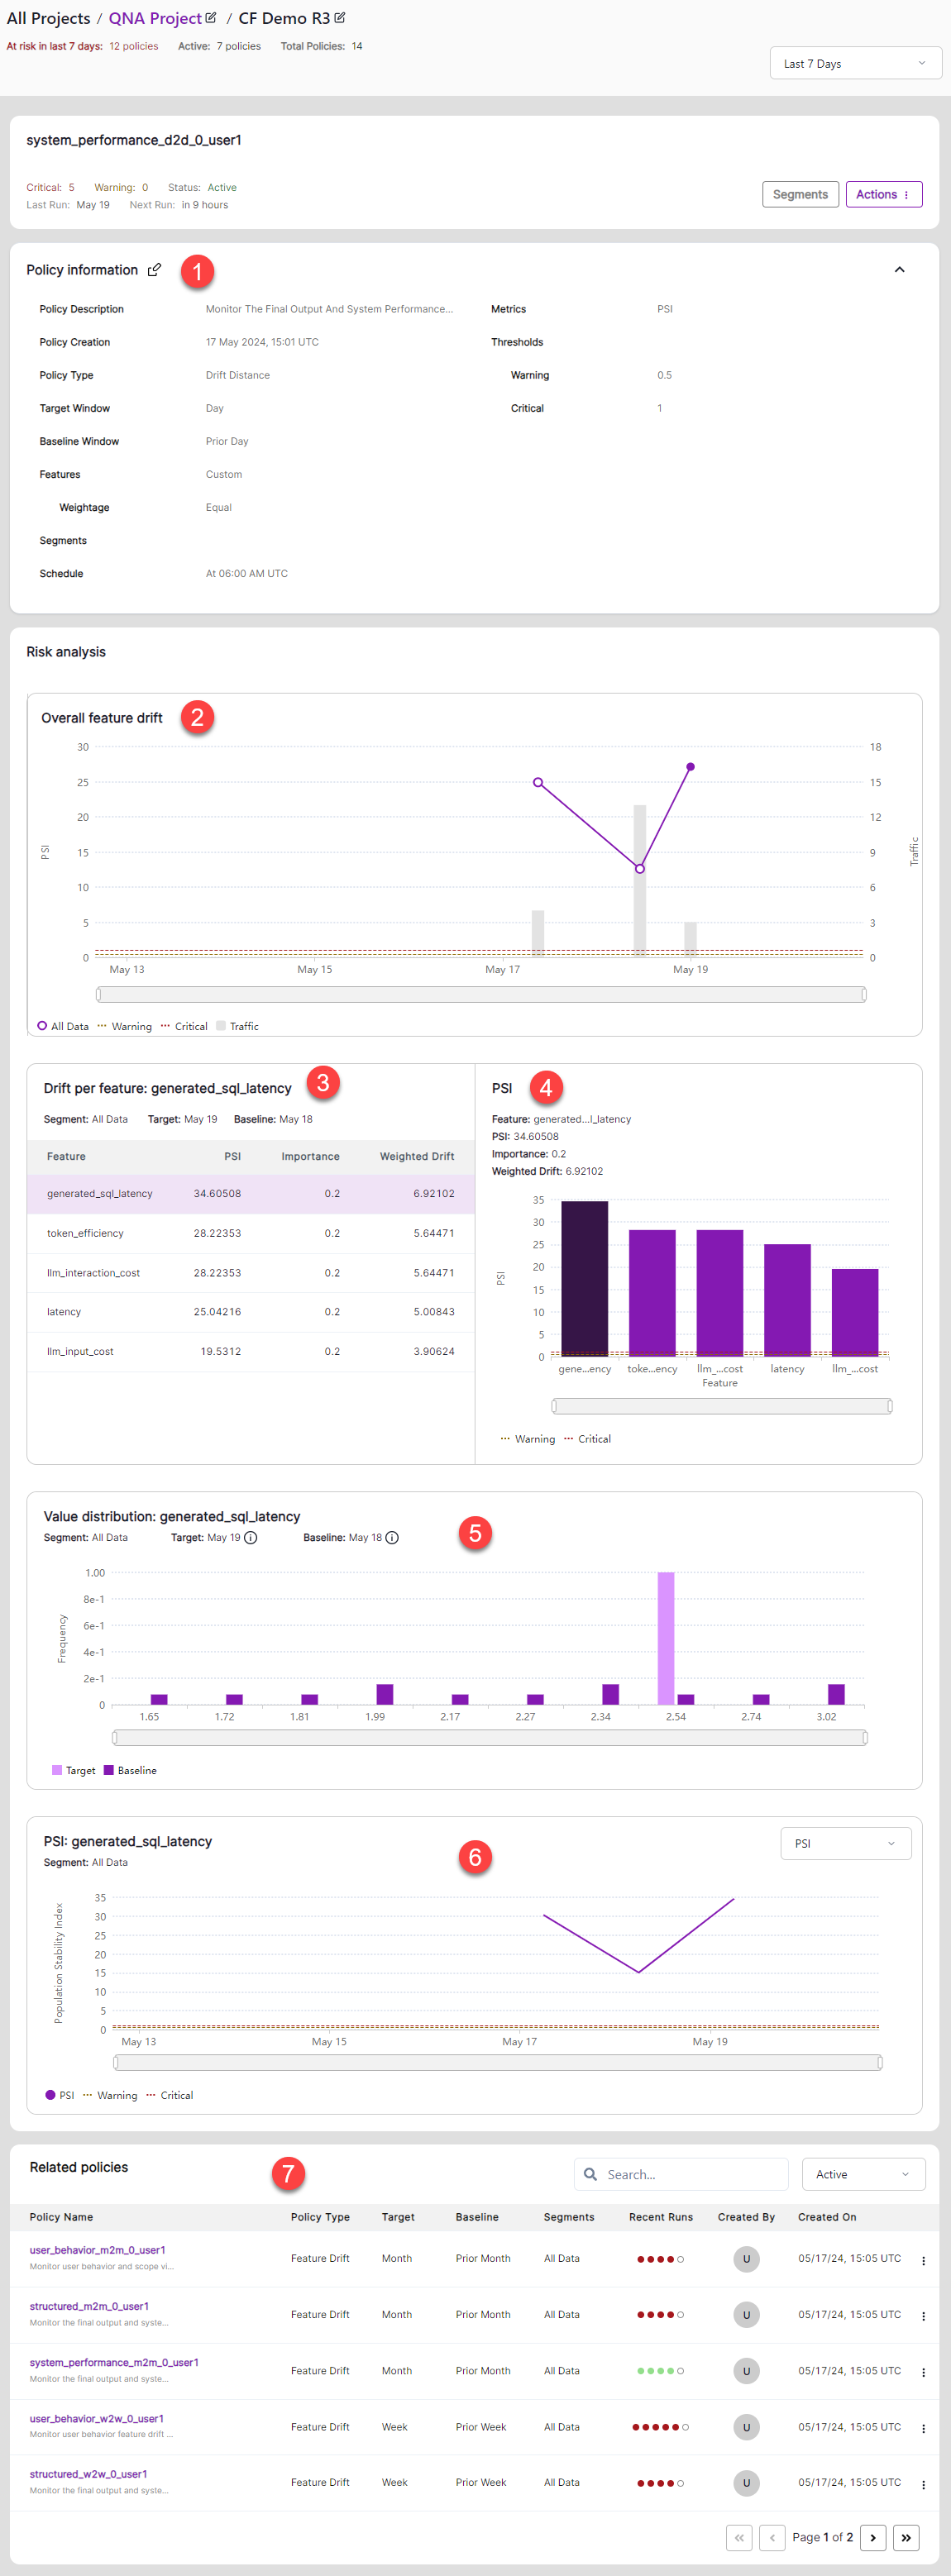
The Policies window shows performance details related to the selected policy.
-
Policy information gives general information about the policy.
-
Overall feature drift shows total feature drift according to changes in Population Stability Index (PSI) with respect to the baseline time period. It also shows total traffic for each day.
-
Drift per feature shows the PSI in tabular form for each feature (or metric). Select a feature to highlight the related bar in the chart.
-
PSI shows PSI in chart form. Select a bar to highlight the related row in the table.
-
Value distribution shows the distribution of the selected feature from the target date against the baseline date.
-
PSI shows the daily PSI of the selected feature.
-
Related Policies shows the other policies. Click the arrow controls to view other pages.