Home
About hila platform
General docs
Admin docs for hila
Developer docs for hila
About Conversational Finance
User docs for Conversational Finance
General docs
Admin docs for Conversational Finance
Developer docs for Conversational Finance
Variance analysis
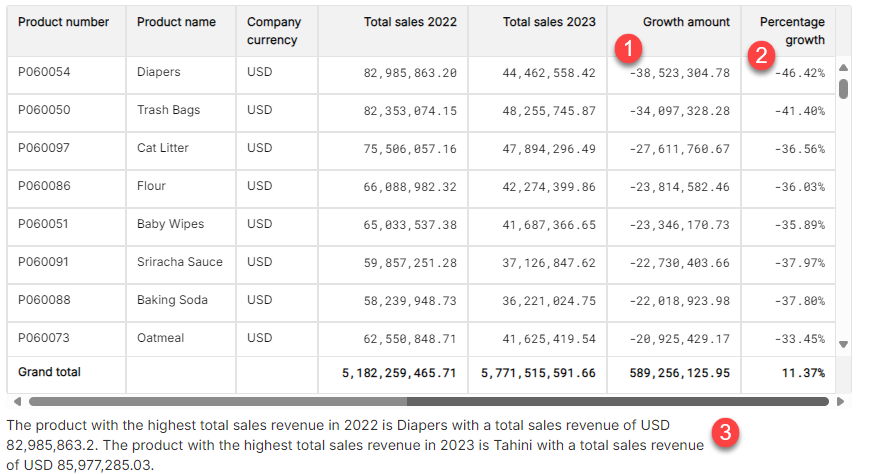
When you ask a question about revenue with a dimension of customer, product, profit center, GL account, or time period, or you ask about expenses with a dimension of supplier, cost center, GL account, or time period, hila produces a side-by-side table view of the variance analysis with five columns, Dimension, 1st time parameter, 2nd time parameter, Variance, and % of change.
- Variance amount is under the column
Growth_amount. - Variance percentage is under the column
Percentage_growth. -
The summary discusses change in revenue or expenses for large variances above a threshold, indicating actionable items for you to investigate.
Dimensions for variance analysis
- Revenue
- By customer
- Revenue by products for a specific customer
- Revenue by GL accounts for a specific customer
- Revenue by profit center for a specific customer
- By product
- Revenue by customers for a specific product
- Revenue by GL accounts for a specific product
- Revenue by profit center for a specific product
- By profit center
- Revenue by products for a specific profit center
- Revenue by customers for a specific profit center
- Revenue by GL accounts for a specific profit center
- By GL account
- Revenue by customers for a specific GL account
- Revenue by products for a specific GL account
- Revenue by profit center for a specific GL account
- By time period
- Quarter
- Q1 22 vs Q2 22 Quarter over Quarter (QoQ)
- Q1 22 vs Q1 23
- Month (Jan, Feb, Mar, …., Nov, Dec)
- Jan vs Feb Month over Month (MoM)
- Jan 22 vs Jan 23
- Year (Fiscal Year)
- 2022 vs 2023 Year over Year (YoY)
- FY22 vs 2023 Year over Year (YoY)
- Quarter
- By customer
- Expenses
- By supplier
- Expenses by cost center for a specific supplier
- Expenses by GL accounts for a specific supplier
- Expenses by category for a specific supplier
- By cost center
- Expenses by supplier for a specific cost center
- Expenses by GL accounts for a specific cost center
- Expenses by category for a specific cost center
- By GL account
- Expenses by supplier for a specific GL account
- Expenses by cost center for a specific GL account
- Expenses by category for a specific GL account
- By time period
- Quarter
- Q1 22 vs Q2 22 Quarter over Quarter (QoQ)
- Q1 22 vs Q1 23
- Month (Jan, Feb, Mar, …., Nov, Dec)
- Jan vs Feb Month over Month (MoM)
- Jan 22 vs Jan 23
- Year (Fiscal Year)
- 2022 vs 2023 Year over Year (YoY)
- FY22 vs 2023 Year over Year (YoY)
- Quarter
- By supplier
TABLE OF CONTENTS